1
Derivatives Rollover Report |July 30, 2020
For Private Circulation Only
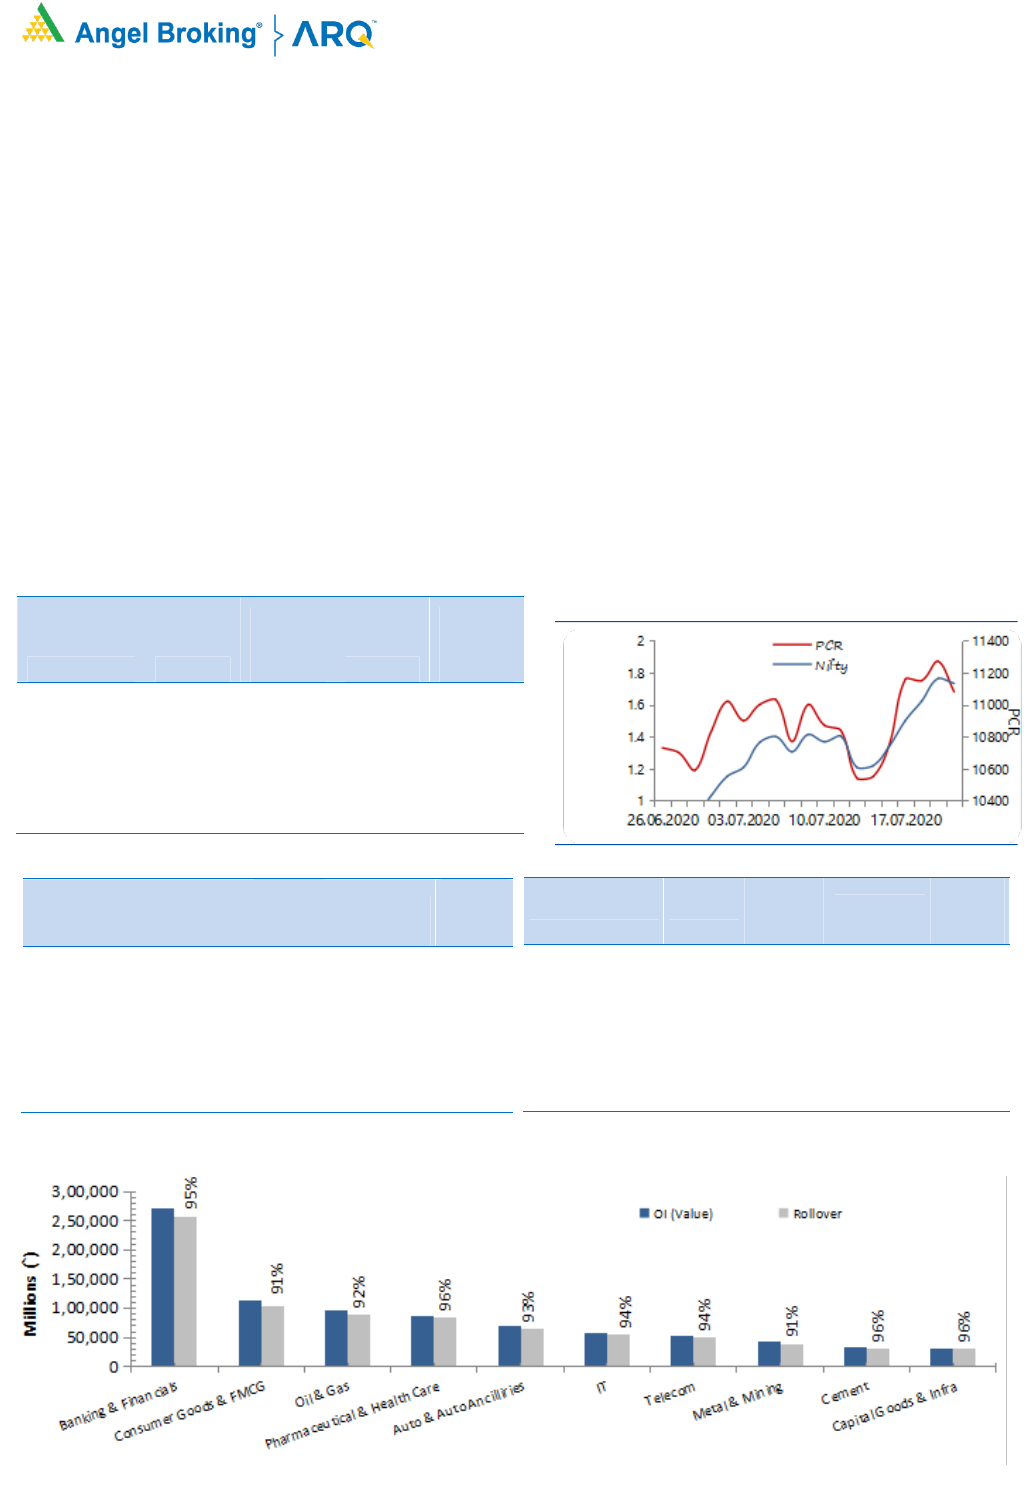
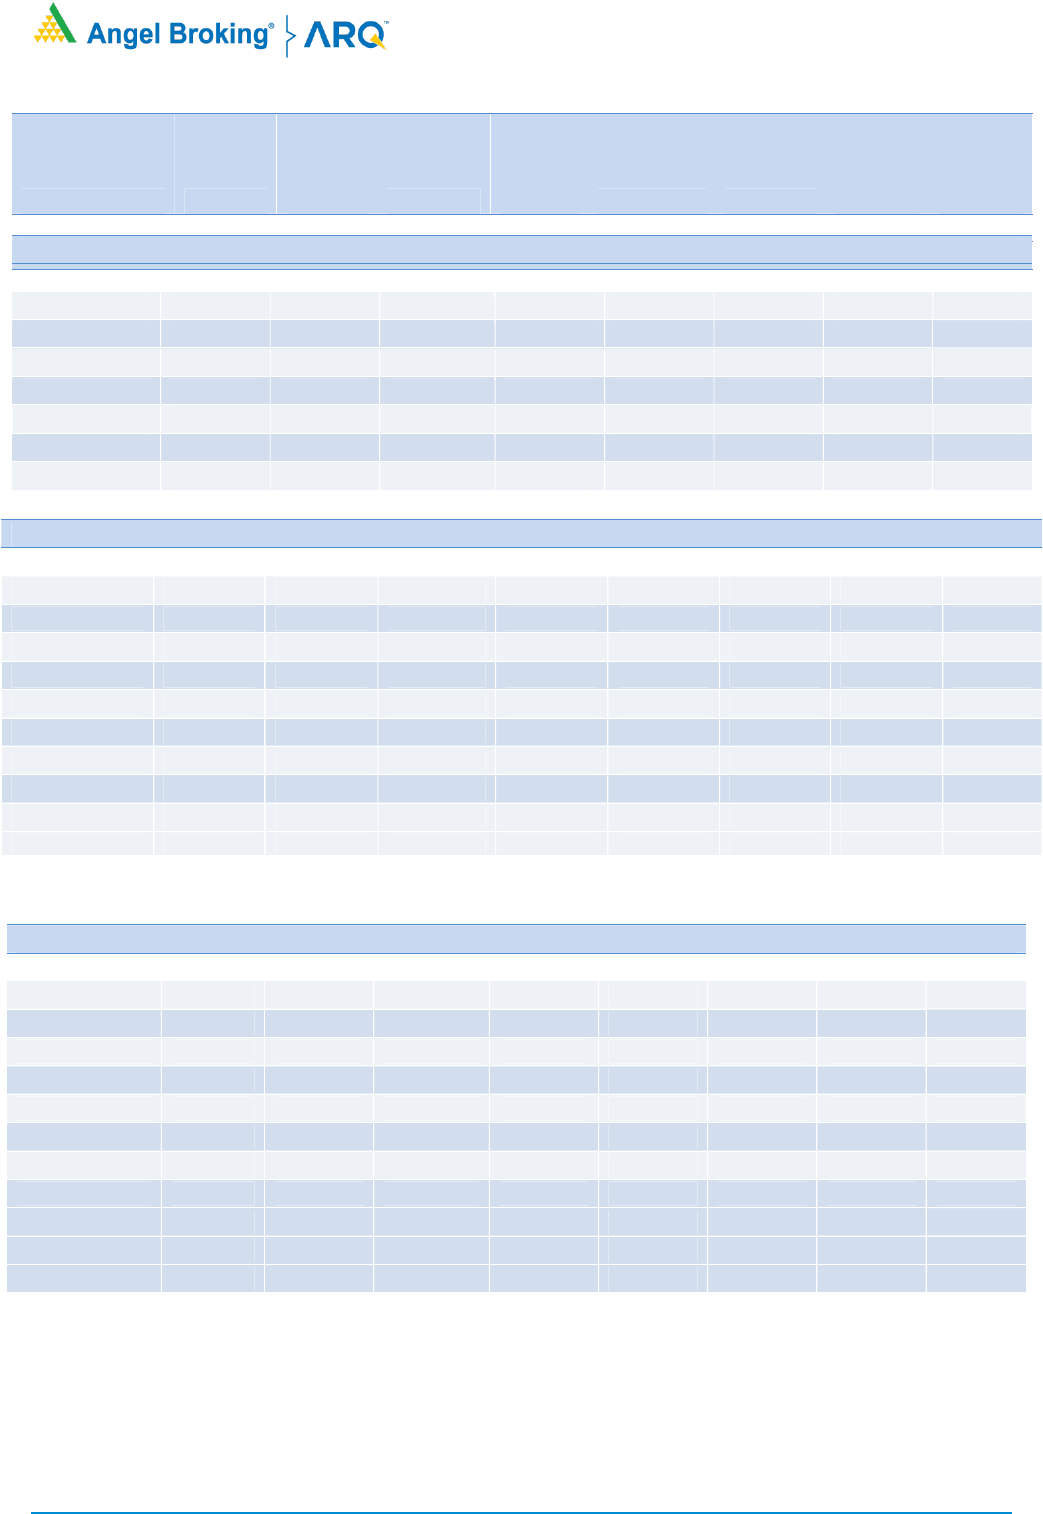
NIFTY & PCR Graph
Monthly Gainers
Scrip Price
Price
Change
(%)
Open
Interest
Ol
Change
(%)
NIITTECH 1940.60
40.44
487500
(4.41)
INFY 964.85
38.02
45295200
(9.03)
WIPRO 284.20
29.89
23846400
5.30
HCLTECH 697.00
26.59
16732800
(7.74)
RELIANCE 2115.40
23.15
33728950
(3.29)
Note: Stocks which have more than 1000 contract in Futures OI.
Monthly Losers
Scrip Price
Price
Change
(%)
Open
Interest
Ol
Change
(%)
IDEA
8.10
(18.59)
124040000
(28.32)
ZEEL
140.80
(18.42)
32619000
41.30
INFRATEL
190.95
(15.32)
11824400
31.68
L&TFH
60.20
(15.03)
26465600
19.39
PNB
31.80
(14.86)
54250000
18.10
Note: Stocks which have more than 1000 contract in Futures OI.
Nifty started the July series around 10400 and rallied throughout the series with some in-
between consolidations. The index
posted gains of about 8 percent while Bank Nifty u
nderperformed the benchmark index and ended with gains of less than a
percent over last expiry’s close.
The rollover in Nifty is at 77.59 percent, which is in line with its 3-
month average of 77.40 percent, whereas rollover in Bank
Nifty is at 75.30 perce
nt v/s its average of 79 percent. During July series, FII’s formed long positions in the index futures
segment; their ‘Long Short Ratio’ at the start of new series is at 66 percent. The weekly options data hints at a probable
trading range of 11000-11300 i
n the initial part of the new series. A move beyond the mentioned range could then lead to
some directional move in the short term. The Bank Nifty has been an underperformer in the recent past and the rollovers
there are not much encouraging.
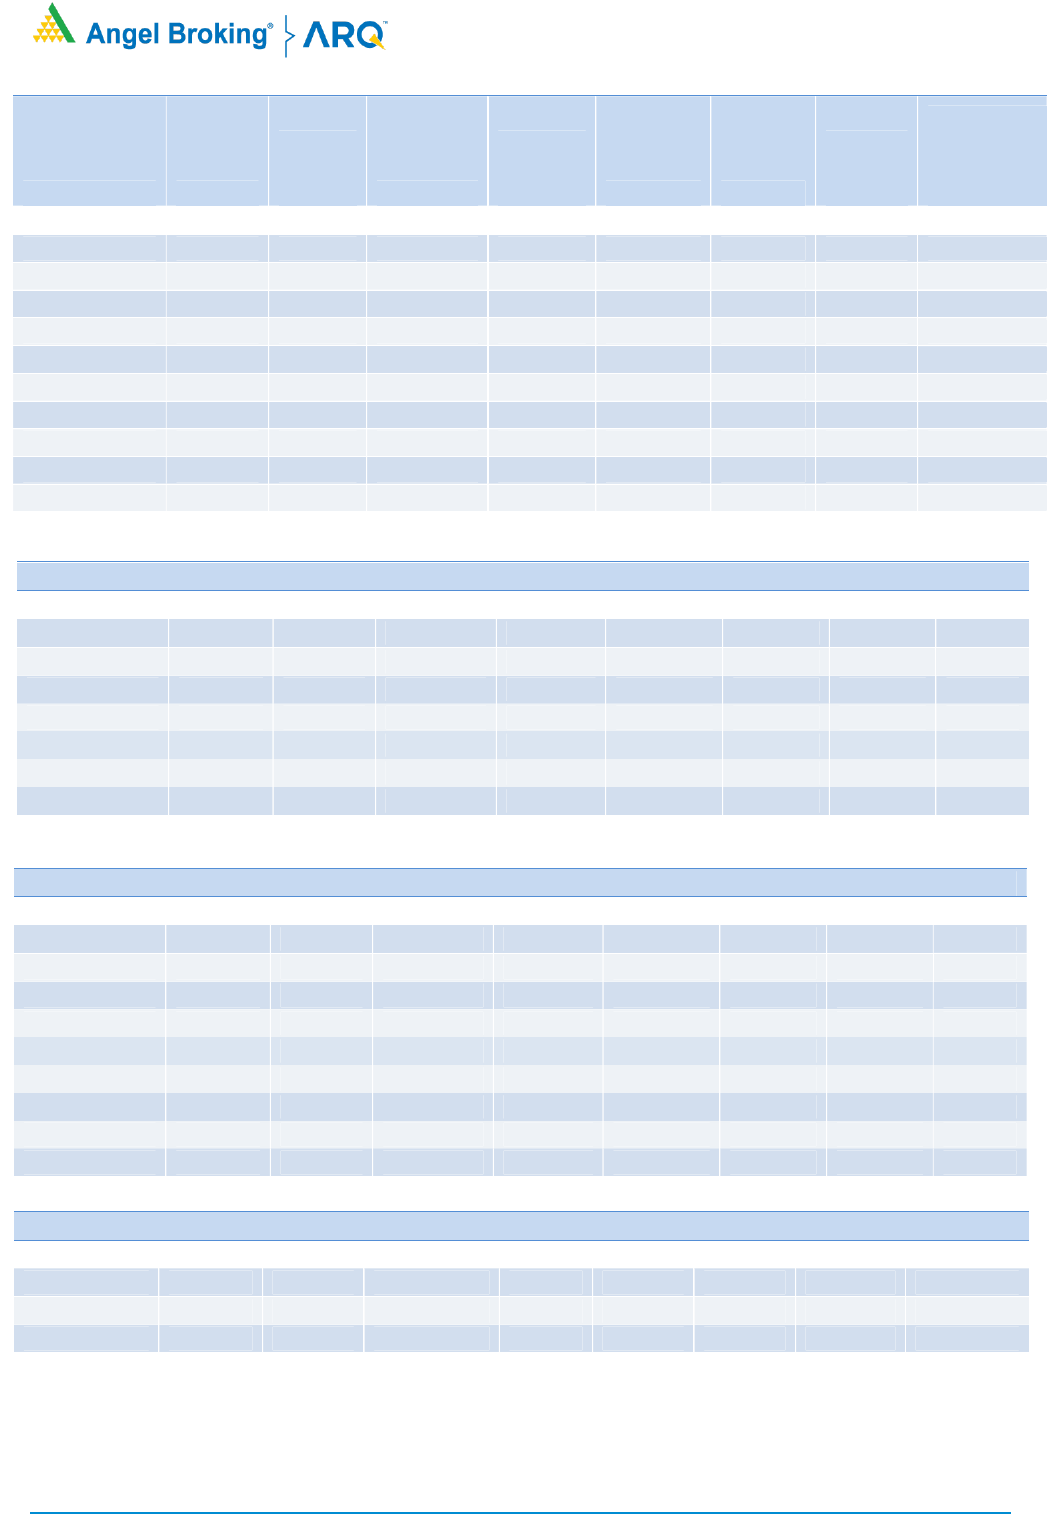
If we look
at the sector specific build up, it is seen that the stocks from the Cement and the Pharma sector have added good
amount of long positions which have been rolled too. So, traders should look for stocks from these sectors for short term
trading opportunities.
Indices Change
INDEX Price
Price
Change
(%) Rollover
3
month
avg.
NIFTY
11102.15 8.27
77.59
77.40
BANKNIFTY
21646.85 0.89
75.30
79.01
-
- -
- -
-
- - - -
-
- - - -
Derivatives Rollover Report
For Private Circulation Only
2
Scrip Price
Price
Change
(%) OI Futures
OI
Change
(%) COC (%) PCR-OI
Rollover
(%)
Average
Rollover
(3month)
(%)
AUTO & AUTO ANCILLARIES
AMARAJABAT 698.45
8.61
1360000
(24.28)
-0.56
0.40
83.64
92.56
APOLLOTYRE 108.55
(3.60)
10900000
6.92
3.01
0.71
95.28
94.54
ASHOKLEY 49.25
(8.20)
40320000
31.49
2.65
0.57
94.90
92.32
BAJAJ-AUTO 3058.30
8.13
1441750
(19.38)
4.00
0.73
91.90
95.59
BALKRISIND 1270.90
2.66
2573600
206.09
6.44
0.49
94.56
86.48
BHARATFORG 386.70
7.97
4965000
(11.21)
4.91
0.38
93.61
94.82
BOSCHLTD 12920.60
12.59
99450
(24.05)
-6.35
0.083
97.40
98.80
EICHERMOT 21107.20
16.55
268835
(2.39)
-5.74
0.52
94.33
95.35
ESCORTS 1134.75
10.01
2013000
(22.49)
5.42
0.36
81.73
88.54
EXIDEIND 154.35
2.52
10868400
(0.07)
3.39
2.37
98.18
92.33
HEROMOTOCO 2713.65
7.14
1973400
(28.99)
4.68
0.57
84.78
90.60
M&M 601.00
18.73
14204400
(19.05)
5.77
0.49
91.33
94.66
MARUTI 6229.00
7.77
2603900
(9.77)
-7.57
0.81
98.47
96.95
MOTHERSUMI 93.85
(2.65)
21504000
(5.07)
2.78
0.94
91.51
94.69
MRF 61325.95
(5.42)
19700
28.26
6.09
0.10
89.95
90.04
TATAMOTORS 103.85
(0.34)
79418100
1.86
2.52
0.83
93.92
93.67
TVSMOTOR 395.95
4.20
5086200
32.54
-20.10
0.66
89.64
93.27
BANKING & FINANCIALS
AXISBANK 426.90
1.11
54481200
(15.32)
3.21
0.71
96.38
96.97
BAJAJFINSV 6200.50
2.63
821750
8.36
4.84
0.56
94.62
95.28
BAJFINANCE 3196.90
6.76
5977250
(8.35)
-8.67
0.63
93.32
92.21
BANKBARODA 46.05
(11.78)
42041400
(2.10)
2.84
0.62
94.61
93.77
CANBK 98.60
(6.18)
9740000
(9.86)
-9.84
1.53
95.16
93.44
CHOLAFIN 211.00
4.09
4690000
(32.40)
-19.47
0.57
75.13
81.69
EQUITAS 50.75
(7.05)
10564000
(15.24)
2.57
0.84
89.74
88.15
FEDERALBNK 54.25
3.53
48883500
(18.41)
2.41
0.69
97.15
95.04
HDFC 1817.15
3.07
27565500
(7.17)
4.68
0.51
98.67
98.43
HDFCBANK 1050.45
2.47
31170700
(9.99)
-0.25
0.47
94.94
95.73
IBULHSGFIN 200.25
(11.51)
10744600
(11.92)
3.59
0.57
82.43
86.40
ICICIBANK 346.10
(1.75)
132108625
18.25
4.35
0.55
96.36
97.05
ICICIPRULI 454.05
5.80
7552500
7.22
3.31
0.22
90.98
94.22
INDUSINDBK 521.85
9.28
26096800
(12.43)
5.02
0.91
97.79
96.91
KOTAKBANK 1378.55
0.50
8611600
(1.75)
-6.26
1.04
94.25
93.53
L&TFH 60.20
(15.03)
26465600
19.39
2.17
0.53
94.35
89.50
LICHSGFIN 258.65
(3.87)
8258000
4.24
-25.93
0.72
92.68
88.83
M&MFIN 173.65
(3.34)
9824444
(13.14)
-77.82
0.39
72.61
83.61
Derivatives Rollover Report
For Private Circulation Only
3
Scrip Price
Price
Change
(%) OI Futures
OI
Change
(%) COC (%) PCR-OI
Rollover
(%)
Average
Rollover
(3month)
(%)
MANAPPURAM 164.35
4.15
19608000
37.48
1.19
0.42
94.97
93.89
MFSL 564.30
6.19
1618500
7.79
3.94
0.28
84.92
90.55
MUTHOOTFIN 1308.30
18.19
2983500
(0.53) 6.01
0.50
94.00
91.83
PFC 82.45
(8.84)
52197800
12.96
6.36
0.90
98.12
97.73
PNB 31.80
(14.86)
54250000
18.10
2.05
1.04
95.61
95.30
RBLBANK 165.95
(11.14)
15488200
(4.55) -23.53
0.73
92.56
87.41
RECLTD 101.25
(11.96)
19146000
40.14
4.52
0.80
96.03
95.01
SBIN 186.90
0.95
103014000
(1.80) 2.45
0.64
92.49
94.84
SRTRANSFIN 686.00
(0.77)
2441887
(5.44) 4.58
0.32
91.02
89.30
UJJIVAN 229.60
4.01
3141600
23.85
-17.64
0.41
87.45
90.44
CAPITAL GOODS & INFRASTRUCTURE
ADANIPORTS 313.75
(9.19)
31125000
1.10
5.21
0.26
97.53
98.51
BHEL 36.90
(3.02)
38283000
(22.39) 3.54
0.47
95.30
91.30
GMRINFRA 22.40
9.00
81630000
4.79
8.79
0.39
92.60
92.20
HAVELLS 577.95
(0.22)
5756000
12.49
-1.24
0.99
98.38
97.49
LT 903.25
(4.38)
9618950
5.52
-7.18
0.43
96.32
88.24
SIEMENS 1143.55
3.01
1890900
(17.06) 1.26
0.74
97.15
94.07
VOLTAS 589.80
6.88
2570000
(29.30) -11.94
0.42
84.18
86.69
CEMENT
ACC 1446.00
15.35
2443000
10.12
-1.08
0.38
95.02
95.19
AMBUJACEM 221.35
18.50
19476000
6.55
0.59
0.67
98.26
98.31
GRASIM 604.20
(0.74)
17263400
(7.15) 2.81
0.74
95.86
97.64
RAMCOCEM 696.10
11.32
1422900
42.83
-3.46
1.35
96.60
96.29
SHREECEM 21477.90
(2.99)
156200
14.26
5.05
0.55
94.27
96.85
ULTRACEMCO 4172.85
9.58
2474800
11.13
5.43
0.58
95.84
95.46
CHEMICALS & FERTILIZERS
PIDILITIND 1353.60
(2.26)
3680000
8.67
4.35
1.06 97.57
98.11
TATACHEM 311.05
(1.69)
2766000
93.97
4.20
0.22 95.78
93.42
UPL
464.35
5.61
15622100
68.49
-
0.70
0.46
91.00
81.00
Consumer Goods & FMCG
ASIANPAINT 1748.65
3.26
5424900
2.68
3.96 0.73
98.54
97.17
BERGEPAINT 527.15
0.90
3677300
(11.58)
1.86 0.32
87.33
90.12
BRITANNIA 3819.70
10.39
1321200
(17.91)
4.71 0.33
88.08
87.59
COLPAL 1436.75
2.40
3056900
47.58
2.14 0.51
97.87
97.92
CONCOR
556.00
(5.86)
7139784
40.51
7.43
0.32
99.05
94.03
Derivatives Rollover Report
For Private Circulation Only
4
Scrip Price
Price
Change
(%) OI Futures
OI
Change
(%) COC (%) PCR-OI
Rollover
(%)
Average
Rollover
(3month)
(%)
DABUR 491.70
6.89
9877500
(19.31)
-0.66
0.45
79.70
88.10
GODREJCP 683.75
0.74
4280000
(30.89)
2.10
0.24
62.69
85.49
HINDUNILVR 2204.50
1.59
15264600
(10.95)
5.28
0.44
95.03
90.51
ITC 193.80
(3.29)
55321600
(23.04)
3.03
0.41
91.38
87.62
JUBLFOOD 1767.55
(0.46)
1972500
(15.03)
-1.95
0.55
85.00
86.79
MARICO 365.50
6.67
10896000
0.59
3.58
0.36
94.60
97.16
MCDOWELL-N 578.15
(4.21)
16455000
26.97
5.78
0.57
94.90
96.90
NESTLEIND 16535.25
(1.65)
400650
(21.03)
0.87
0.65
81.62
92.88
TATACONSUM 425.85
10.52
14909400
18.12
2.91
0.33
89.45
92.37
TITAN 1040.15
6.05
6201000
(2.20)
-2.13
0.64
90.53
94.20
UBL
962.60
(7.96)
1109500
53.73
-
3.31
1.22
73.96
87.96
METALS & MINING
COALINDIA 129.15
(8.14)
27676000
(17.93)
5.58
0.85
83.80
90.79
HINDALCO 161.75
10.00
24544400
(22.08)
-2.01
0.61
74.34
86.84
JINDALSTEL 182.70
21.60
16020000
19.55
1.07
0.66
95.87
90.28
JSWSTEEL 214.75
11.67
41634000
7.01
2.43
0.83
93.96
96.23
NATIONALUM 32.65
(4.81)
38165000
4.22
6.02
0.61
93.70
93.74
NMDC 87.00
2.72
33922100
31.88
2.25
0.49
96.59
97.57
SAIL 34.45
11.13
34694000
(15.74)
7.61
0.67
91.94
88.64
TATASTEEL 357.00
11.84
14907300
(5.88)
-34.14
0.59
88.25
86.30
VEDL 111.85
0.45
109678000
2.55
11.17
0.97
95.59
94.03
Media
PVR 1054.50
3.97
1682538
41.48
-34.66
0.74
95.89
88.26
SUNTV 386.00
(7.07)
4264500
(22.95)
-1.35
1.35
93.21
94.08
ZEEL 140.80
(18.42)
32619000
41.30
5.58
0.62
93.53
89.28
INFORMATION TECHNOLOGY
HCLTECH 697.00
26.59
16732800 (7.74)
2.91
0.63
90.37 91.67
INFY 964.85
38.02
45295200 (9.03)
4.61
0.87
95.81 96.88
MINDTREE 1083.00
19.08
1248800 (4.76)
-0.84
0.31
93.31 91.60
NIITTECH 1940.60
40.44
487500 (4.41)
2.69
0.55
82.80 87.63
TCS 2289.00
13.61
10003800 26.84
5.46
0.94
96.17 83.26
TECHM 677.65
23.06
12362400 (26.16)
5.60
0.49
95.34 97.30
WIPRO 284.20
29.89
23846400 5.30
0.46
0.56
93.15 93.80
Derivatives Rollover Report
For Private Circulation Only
5
Scrip Price
Price
Change
(%) OI Futures
OI
Change
(%) COC (%) PCR-OI
Rollover
(%)
Average
Rollover
(3month)
(%)
INFORMATION TECHNOLOGY
HCLTECH 564.00
(0.70)
22885800
(1.26)
8.14
0.58
98.56
96.78
INFY 730.55
3.77
24351600
(52.50)
2.86
0.74
55.98
79.52
MINDTREE 782.95
10.93
1041600
(14.29)
-15.63
0.59
93.13
93.37
NIITTECH 1606.65
6.68
578250
26.08
-2.03
0.46
89.76
82.99
TCS 2212.80
6.19
15671500
(17.22)
6.42
1.91
95.02
94.74
TECHM 775.75
1.00
15406800
8.21
9.05
0.65
96.29
97.15
WIPRO 249.90
3.65
18211200
(29.64)
-2.08
0.72
83.12
92.60
MISCELLANIOUS
ADANIENT 175.80
8.25
15532000
(13.00)
5.59
0.35
96.14
96.08
APOLLOHOSP 1675.50
16.14
1262500
10.99
-30.88
0.57
80.49
90.61
BATAINDIA 1265.90
(3.98)
2275900
72.20
3.87
0.89
91.31
94.61
BEL 95.40
13.44
24540400
42.00
-3.41
0.64
75.83
82.07
CONCOR 449.00
5.50
4082556
(11.91)
-2.75
0.47
73.14
89.20
CUMMINSIND 386.35
(4.58)
1734000
38.15
-37.68
0.89
96.98
91.16
INDIGO 941.55
(9.85)
2801500
14.86
4.10
0.86
96.35
89.33
OIL & GAS
BPCL 420.50
13.24
21551400
16.37
4.35
0.58
91.66
94.69
GAIL 96.95
(6.06)
26053100
(24.66)
4.72
0.80
92.15
94.78
HINDPETRO 223.85
5.04
22485600
39.45
4.68
0.52
89.94
81.21
IGL 402.35
(9.64)
8274750
8.06
0.32
0.59
91.29
90.86
IOC 89.00
4.22
47788800
(10.95)
6.62
0.78
89.31
93.85
MGL 987.50
(7.97)
804600
21.69
0.53
0.39
89.28
93.53
ONGC 78.00
(4.70)
38792600
(45.25)
5.03
0.55
72.61
88.14
PETRONET 245.10
(6.40)
13242000
6.34
2.66
0.43
91.69
91.95
RELIANCE 2115.40
23.15
33728950
(3.29)
4.05
0.78
94.33
92.19
PHARMACEUTICAL
AUROPHARMA 824.40
4.07
13249600
18.65
5.80
0.46
98.46
97.32
BIOCON 404.45
(0.31)
15354800
1.54
3.23
0.49
97.50
91.72
CADILAHC 367.35
0.73
8340200
44.03
6.06
0.77
97.96
90.30
CIPLA 689.15
8.15
12810200
4.73
6.08
0.46
93.12
87.70
DIVISLAB 2564.90
9.69
3795200
20.76
1.32
0.25
96.04
97.69
DRREDDY 4521.60
13.14
3411750
5.91
1.44
0.91
97.01
97.24
GLENMARK 443.55
(3.89)
5437200
44.32
6.35
0.36
90.89
90.14
LUPIN 885.75
(5.30)
8088600
15.61
-6.81
0.62
86.50
91.23
PEL 1370.85
2.77
3209800
(18.62)
0.71
0.70
97.53
97.08
SUNPHARMA 511.15
4.54
30380000
(6.67)
3.07
0.59
96.94
96.85
TORNTPHARM 2448.25
(2.21)
1730000
47.11
5.72
0.33
98.55
97.35
Derivatives Rollover Report
For Private Circulation Only
6
Scrip Price
Price
Change
(%) OI Futures
OI
Change
(%) COC (%) PCR-OI
Rollover
(%)
Average
Rollover
(3month)
(%)
POWER
NTPC 86.75
(9.78)
55307100
(8.18)
2.26
0.78
78.07
91.37
POWERGRID 174.40
(2.79)
13712000
(56.62)
-18.06
0.88
59.60
84.53
TATAPOWER 48.25
9.91
55836000
4.18
6.79
0.72
97.36
91.47
TORNTPOWER 321.15
(1.86)
1419000
(19.28)
4.28
0.52
92.02
91.65
REAL ESTATE
DLF 140.10
(11.19)
20733900
(21.22)
0.00
0.80
65.12 85.94
TELECOM
BHARTIARTL 551.05
(1.29)
82523133
5.04
-3.89
0.61
96.32
93.81
IDEA 8.10
(18.59)
124040000
(28.32)
16.29
0.23
47.74
66.31
INFRATEL 190.95
(15.32)
11824400
31.68
-10.50
0.85
90.45
92.39
TEXTILES
CENTURYTEX 298.40
(2.86)
2427600
0.81
-8.46
0.34
96.55
88.90
PAGEIND 19605.55
(3.56)
92460
(18.23)
0.13
1.80
84.05
80.17
SRF 3759.55
4.03
689000
35.03
-0.21
0.30
97.49
97.33
CENTURYTEX
487.95
4.96
3472200
3.19
9.28
0.26
98.91
84.95

Derivatives Rollover Report
For Private Circulation Only
7
Technical and Derivatives Team:
Sameet Chavan Chief Analyst - Technical & Derivatives sameet.chavan@angelbroking.com
Ruchit Jain Senior Analyst - Technical & Derivatives ruchit.jain@angelbroking.com
Rajesh Bhosale Technical Analyst rajesh.bhosle@angelbroking.com
Sneha Seth Derivatives Analyst sneha.seth@angelbroking.com
Research Team Tel: 022 - 39357600 (EXTN - 6844) Website: www.angelbroking.com
For Technical & Derivative Queries E-mail: technicalresearch-cso@angelbroking.com
DISCLAIMER
Angel Broking Limited (hereinafter referred to as “Angel”) is a registered Member of National Stock Exchange of India Limited,
Bombay Stock Exchange Limited and Metropolitan Stock Exchange Limited. It is also registered as a Depository Participant with
CDSL and Portfolio Manager and Investment Adviser with SEBI. It also has registration with AMFI as a Mutual Fund Distributor.
Angel Broking Limited is a registered entity with SEBI for Research Analyst in terms of SEBI (Research Analyst) Regulations, 2014
vide registration number INH000000164. Angel or its associates has not been debarred/ suspended by SEBI or any other regulatory
authority for accessing /dealing in securities Market. Angel or its associates/analyst has not received any compensation / managed
or co-managed public offering of securities of the company covered by Analyst during the past twelve months.
This document is solely for the personal information of the recipient, and must not be singularly used as the basis of any
investment decision. Nothing in this document should be construed as investment or financial advice. Each recipient of this
document should make such investigations as they deem necessary to arrive at an independent evaluation of an investment in the
securities of the companies referred to in this document (including the merits and risks involved), and should consult their own
advisors to determine the merits and risks of such an investment.
Reports based on technical and derivative analysis center on studying charts of a stock's price movement, outstanding positions
and trading volume, as opposed to focusing on a company's fundamentals and, as such, may not match with a report on a
company's fundamentals. Investors are advised to refer the Fundamental and Technical Research Reports available on our website
to evaluate the contrary view, if any.
The information in this document has been printed on the basis of publicly available information, internal data and other reliable
sources believed to be true, but we do not represent that it is accurate or complete and it should not be relied on as such, as this
document is for general guidance only. Angel Broking Limited or any of its affiliates/ group companies shall not be in any way
responsible for any loss or damage that may arise to any person from any inadvertent error in the information contained in this
report. Angel Broking Limited has not independently verified all the information contained within this document. Accordingly, we
cannot testify, nor make any representation or warranty, express or implied, to the accuracy, contents or data contained within this
document. While Angel Broking Limited endeavors to update on a reasonable basis the information discussed in this material,
there may be regulatory, compliance, or other reasons that prevent us from doing so.
This document is being supplied to you solely for your information, and its contents, information or data may not be reproduced,
redistributed or passed on, directly or indirectly.
Neither Angel Broking Limited, nor its directors, employees or affiliates shall be liable for any loss or damage that may arise from or
in connection with the use of this information.
